CareerMap: visualizing career trajectory
Wu, Kan; Tang, Jie; Shao, Zhou; Xu, Xinyi; Gao, Bo; Zhao, Shu
Sci China Inf Sci, 2018, 61(10): 104101
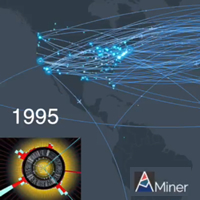
This study introduces a system named CareerMap that visualizes a scholar's career trajectory. As an online demonstration of CareerMap, we have shown the visualization result by CareerMap for the AMiner 2016 most influential scholars in machine learning (ML). Each trajectory path on the map represents the movement of a scholar between different places (affiliations). The heatmap reveals the geographic distribution of the most influential ML scholars; a larger hotspot means a larger immigration of scholars into an affiliation. The right sidebar is a list of all scholars. When the user selects (clicks on) a scholar, the trajectory path of that scholar is highlighted in the map. The bottom bar shows the timeline. When the user selects a specific year, a textbox at the bottom displays the most important work (paper) published in that year by a scholar in the right-hand list. This example provides the track records of over half of the most influential ML scholars at the east and west coasts of the USA, and in west Europe. By zooming in, the user can also check the city-level results or obtain finer details.